Table of Contents
- What Is a TikTok Analytics Report?
- What Should a TikTok Analytics Report Include?
- 1. Reporting Period
- 2. Account Overview
- 3. Follower Growth
- 4. Video Views and Reach
- 5. Engagement Metrics
- 6. Top-Performing Content
- 7. Audience Insights
- 8. Content Performance by Format or Topic
- Which TikTok Metrics Should You Track?
- How to Structure a TikTok Report
- Don't Just Report the Numbers
- How Often Should You Create a TikTok Analytics Report?
- Weekly Reporting
- Monthly Reporting
- Campaign Reporting
- Why Use a TikTok Analytics Report Template?
- Creating a Professional TikTok Report
- Final Thoughts
Posting consistently on TikTok is only part of a successful social media strategy. To understand whether your content is actually working, you need to look beyond individual videos and review the data over time.
A well-structured TikTok analytics report template can help you organize important performance data, identify content trends, and understand which types of videos are generating the strongest response from your audience.
Whether you manage a brand account, work as a social media marketer, or report campaign performance to a client, a clear TikTok report makes analytics easier to understand and act on.
What Is a TikTok Analytics Report?
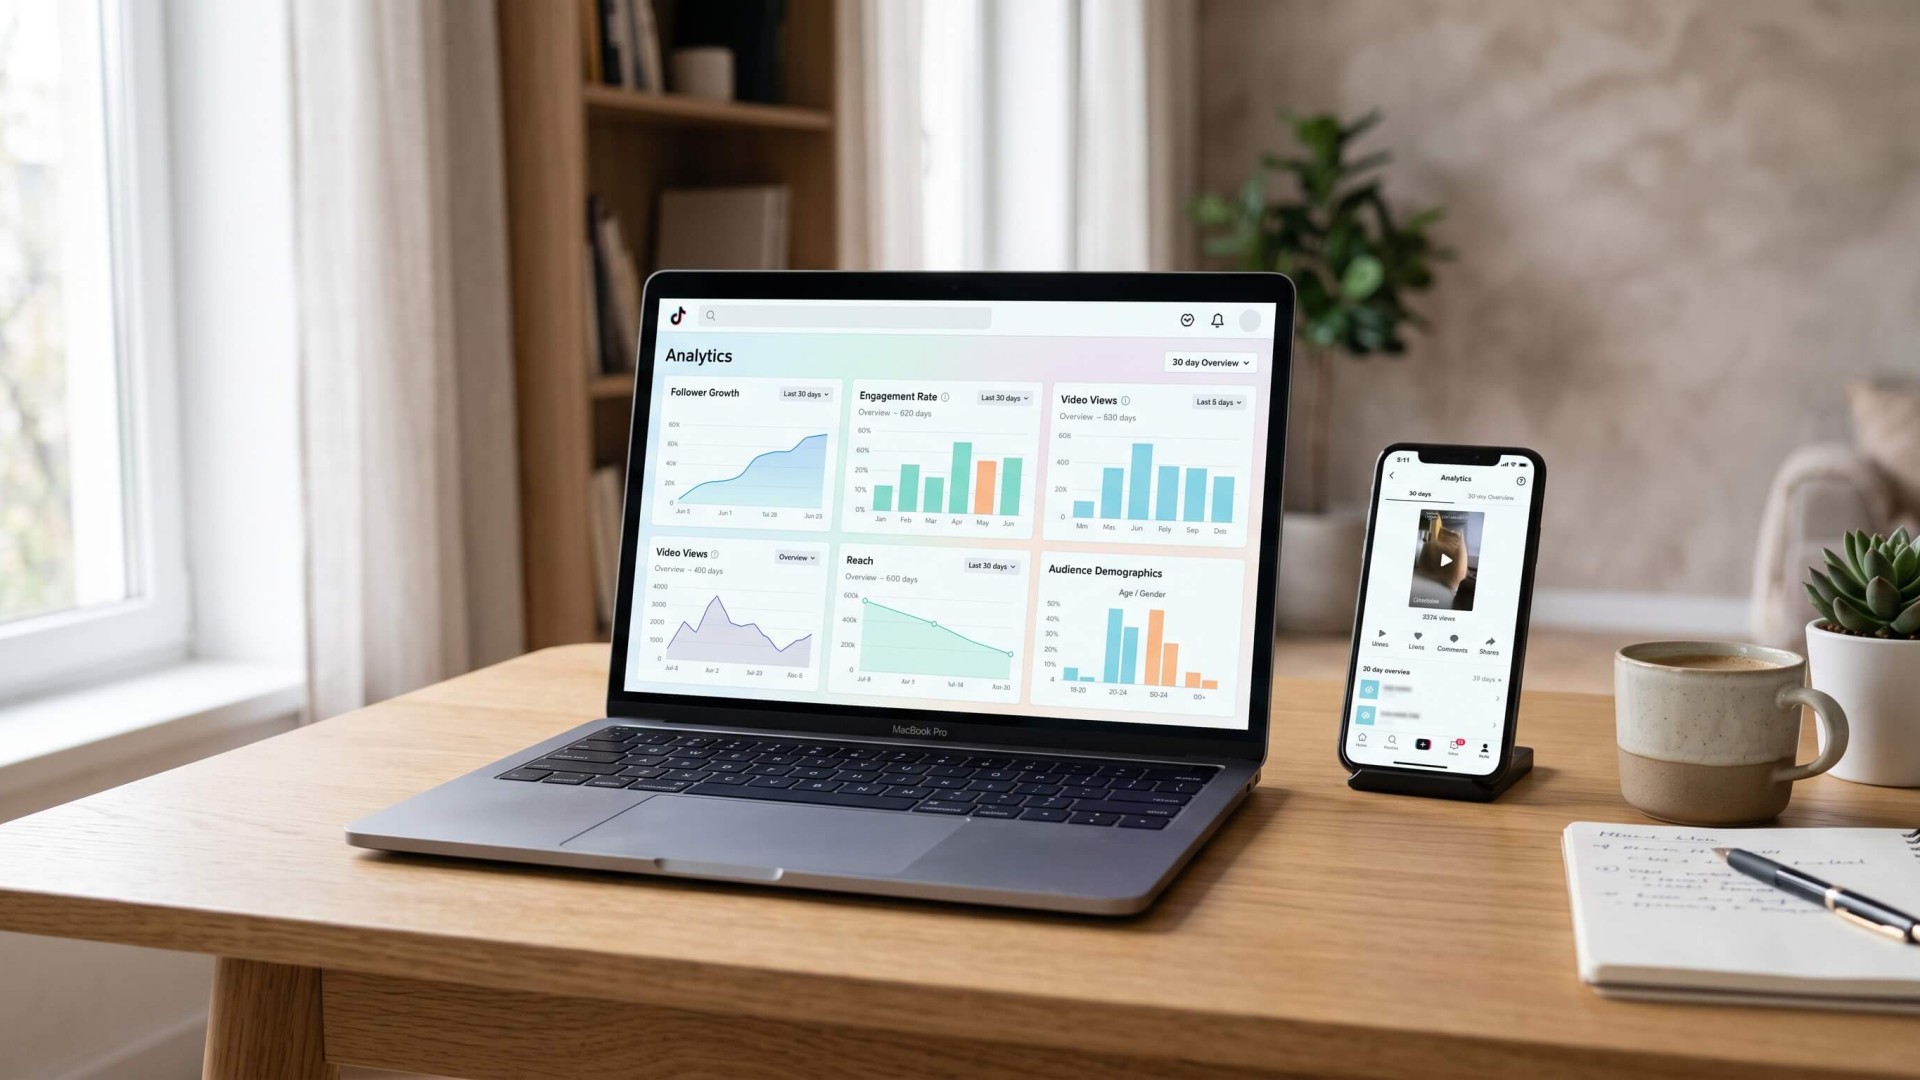
A TikTok analytics report is a structured summary of account and content performance over a specific period. Instead of looking at individual metrics inside TikTok Analytics, a report brings the most relevant data together in one place.
A typical report can cover follower growth, video views, reach, engagement, audience information, and the performance of individual videos.
The goal is not simply to show how many views an account received. A useful report should help answer questions such as:
- How did the account perform during the reporting period?
- Which videos generated the strongest engagement?
- Did the audience grow?
- Which content formats performed better than others?
- How did performance compare with the previous period?
- What should the social media team do next?
That last question is particularly important. A good social media analytics report should turn data into information that can support future content decisions.
What Should a TikTok Analytics Report Include?
There is no single format that every TikTok report needs to follow. The metrics you include can depend on the account, campaign objectives, and reporting period.
However, several sections are useful for most TikTok analytics reports.
1. Reporting Period
Start by clearly defining the period covered by the report. This could be a week, month, quarter, or specific campaign period.
For example, a monthly report might cover TikTok performance from September 1 to September 30.
Defining the reporting period makes the data easier to interpret and compare. It also prevents confusion when the report is reviewed alongside previous or future reports.
2. Account Overview
The first section can provide a quick overview of the account's overall performance.
Depending on your objectives, this section may include:
- Total followers
- Follower growth
- Total video views
- Profile views
- Total likes
- Total comments
- Total shares
- Engagement rate
These numbers work well as high-level KPIs because they give readers an immediate understanding of how the account performed during the selected period.
3. Follower Growth
Follower count is one of the easiest TikTok metrics to track, but the change over time can be more useful than the total number alone.
Your report can show the starting follower count, ending follower count, and net growth during the reporting period.
A simple chart can also make growth trends easier to identify. For example, a sudden increase in followers may coincide with a video that received unusually high reach.
Instead of only reporting that an account gained followers, try to connect the growth with content performance where possible.
4. Video Views and Reach
Video views are an important part of TikTok performance reporting because they indicate how often content was viewed.
However, views should not be analyzed in isolation. Comparing views with engagement and other performance indicators can provide a more useful picture of content performance.
Your report may include:
- Total video views
- Average views per video
- Highest-viewed video
- Lowest-viewed video
- Reach, where available
- Changes compared with the previous period
This section can help identify whether overall visibility is increasing or whether performance is being driven by only a small number of videos.
5. Engagement Metrics
Views tell you how many times content was watched, but engagement provides additional context about how viewers responded.
A TikTok analytics report can include:
- Likes
- Comments
- Shares
- Saves or favorites, where available
- Engagement rate
Looking at these metrics together can reveal different types of audience response. A video with fewer views but a strong engagement rate may be worth examining just as closely as a video with a very high view count.
6. Top-Performing Content
One of the most useful sections in a TikTok report is a breakdown of the best-performing videos.
A simple table can include the video title or description, publication date, views, likes, comments, shares, and engagement rate.
For example:
| Content | Views | Likes | Comments | Shares |
|---|---|---|---|---|
| Product Tutorial | 125K | 8.4K | 320 | 1.1K |
| Behind the Scenes | 86K | 5.7K | 280 | 740 |
| Customer Tips | 64K | 4.2K | 190 | 520 |
The exact metrics will vary depending on the data available, but the purpose is the same: make it easy to identify which content deserves further analysis.
7. Audience Insights
Performance data tells you what happened. Audience data can help explain who is engaging with the content.
Where relevant and available, consider including information such as:
- Age groups
- Gender distribution
- Audience location
- Peak activity periods
- Follower activity patterns
Audience insights can become particularly useful when comparing them with your intended target audience.
For example, if a campaign is designed for a specific age group but most engagement comes from another audience segment, that difference may be worth discussing in the report.
8. Content Performance by Format or Topic
Looking at individual videos is useful, but grouping content can reveal broader patterns.
You could categorize TikTok content by:
- Educational content
- Product demonstrations
- Behind-the-scenes videos
- Entertainment
- Customer stories
- Promotional content
You can then compare average views, engagement, or other relevant metrics across those categories.
This makes the report more useful for content planning because it moves the analysis from individual posts toward recurring content patterns.
Which TikTok Metrics Should You Track?
Not every metric needs to appear in every report. The most useful metrics depend on what the account is trying to achieve.
For a general TikTok performance report, these metrics are often useful:
- Video views: Shows how many times videos were viewed.
- Likes: Indicates positive reactions to content.
- Comments: Provides a view of audience conversation and interaction.
- Shares: Can indicate that viewers found content useful or worth passing along.
- Follower growth: Shows changes in the account's audience size.
- Profile views: Helps measure interest in the account beyond individual videos.
- Average watch time: Helps evaluate how long viewers stay with the content.
- Completion rate: Can help assess how many viewers watched a video through to the end.
The important point is to select metrics that relate to the purpose of the account or campaign rather than filling the report with every number available.
How to Structure a TikTok Report
A simple structure can make a report much easier to scan.
For example, a monthly TikTok report could follow this order:
- Executive summary — a short overview of the most important results.
- KPI overview — key numbers such as followers, views, and engagement.
- Content performance — the best and weakest-performing videos.
- Audience insights — relevant information about the audience.
- Trend analysis — changes compared with previous periods.
- Recommendations — practical actions for the next reporting period.
This structure works because readers can get the big picture first and then explore the supporting data.
Don't Just Report the Numbers
A common problem with social media reporting is presenting a large collection of metrics without explaining what they mean.
For example, saying that video views increased by 35% provides useful information, but the report becomes more valuable when you investigate what contributed to that change.
Was there a specific video that generated most of the additional views? Did the account publish more frequently? Did a particular topic or format perform differently?
The analysis does not always need to provide a definitive answer. It should, however, identify meaningful patterns that the team can investigate or use when planning future content.
How Often Should You Create a TikTok Analytics Report?
The ideal reporting frequency depends on how actively the account is managed and what the report is being used for.
Weekly Reporting
Weekly reporting can be useful for actively managed accounts or campaigns where content performance needs to be monitored frequently.
The report can stay relatively lightweight and focus on major changes, top-performing videos, and unusual performance patterns.
Monthly Reporting
Monthly reporting provides more context because there is enough data to identify broader trends.
It is often a practical format for client reporting, internal marketing reviews, and monthly content planning.
Campaign Reporting
For a specific TikTok campaign, the reporting period can follow the campaign itself rather than a standard calendar period.
This allows the team to compare campaign objectives with the actual results generated during the campaign.
Why Use a TikTok Analytics Report Template?
Creating a report from scratch every month can take unnecessary time, especially when the same sections and metrics are used repeatedly.
A TikTok analytics report template provides a consistent structure that can be reused for different reporting periods or clients.
A good template can help you:
- Save time when preparing reports
- Keep important metrics organized
- Maintain a consistent reporting format
- Make performance trends easier to compare
- Present analytics in a more professional format
- Spend more time analyzing data instead of formatting slides
This is especially useful for agencies and marketing teams that need to create multiple social media reports regularly.
Creating a Professional TikTok Report
The best TikTok report is not necessarily the one with the most charts or the largest number of metrics. It is the one that makes the important information easy to understand.
Start with the key KPIs, show how performance changed, highlight the content that made the biggest difference, and connect the findings with the next steps.
If you want to speed up the design process, Brandalytics TikTok Analytics Report Template provides a ready-made presentation structure for organizing TikTok performance data.
You can also explore more social media report templates from Appiqa for other types of marketing and analytics reporting.
Final Thoughts
A TikTok analytics report should do more than display numbers. It should provide a clear view of account performance, show which content is generating results, and help turn analytics into better content decisions.
At a minimum, consider including follower growth, video views, engagement, top-performing content, audience insights, and comparisons with previous periods. From there, you can add metrics that are directly connected to your campaign or business objectives.
With a consistent TikTok analytics report template, your team can spend less time formatting reports and more time understanding what the data is telling you.