Posting content is one thing — but showing what actually worked is another. Whether you're reporting to a client, a manager, or just reviewing your own results, a clear and well-designed social media report helps turn data into insight.
The good news? You don’t need to be a designer to make one. With PowerPoint and the right layout, you can build a professional report that looks great and makes sense.
Why Make a Social Media Report?
Social media reports help you:
- Highlight key metrics like reach, engagement, and growth
- Show how content is performing across different platforms
- Share progress with clients, teams, or stakeholders
- Make smarter decisions for future campaigns
It’s not just about numbers — it’s about telling the story behind your social media efforts.
What Should You Include?
A great social media report usually covers:
- Summary or Overview – A quick snapshot of the results
- Platform Performance – Breakdowns for Instagram, TikTok, LinkedIn, etc.
- Top Content – Which posts had the most impact?
- Audience Insights – Who's engaging with your content?
- Campaign Highlights – What worked well, and why
- Actionable Next Steps – What to try moving forward
Why Use PowerPoint?
PowerPoint makes it easy to turn data into visuals — especially if you’re presenting results to others. You can add charts, photos, icons, and even animations. Plus, it’s flexible enough to work as both a live presentation and a downloadable PDF report.
Save Time with a Ready-to-Use Template
Need a shortcut? Try this done-for-you template designed specifically for social media reporting:
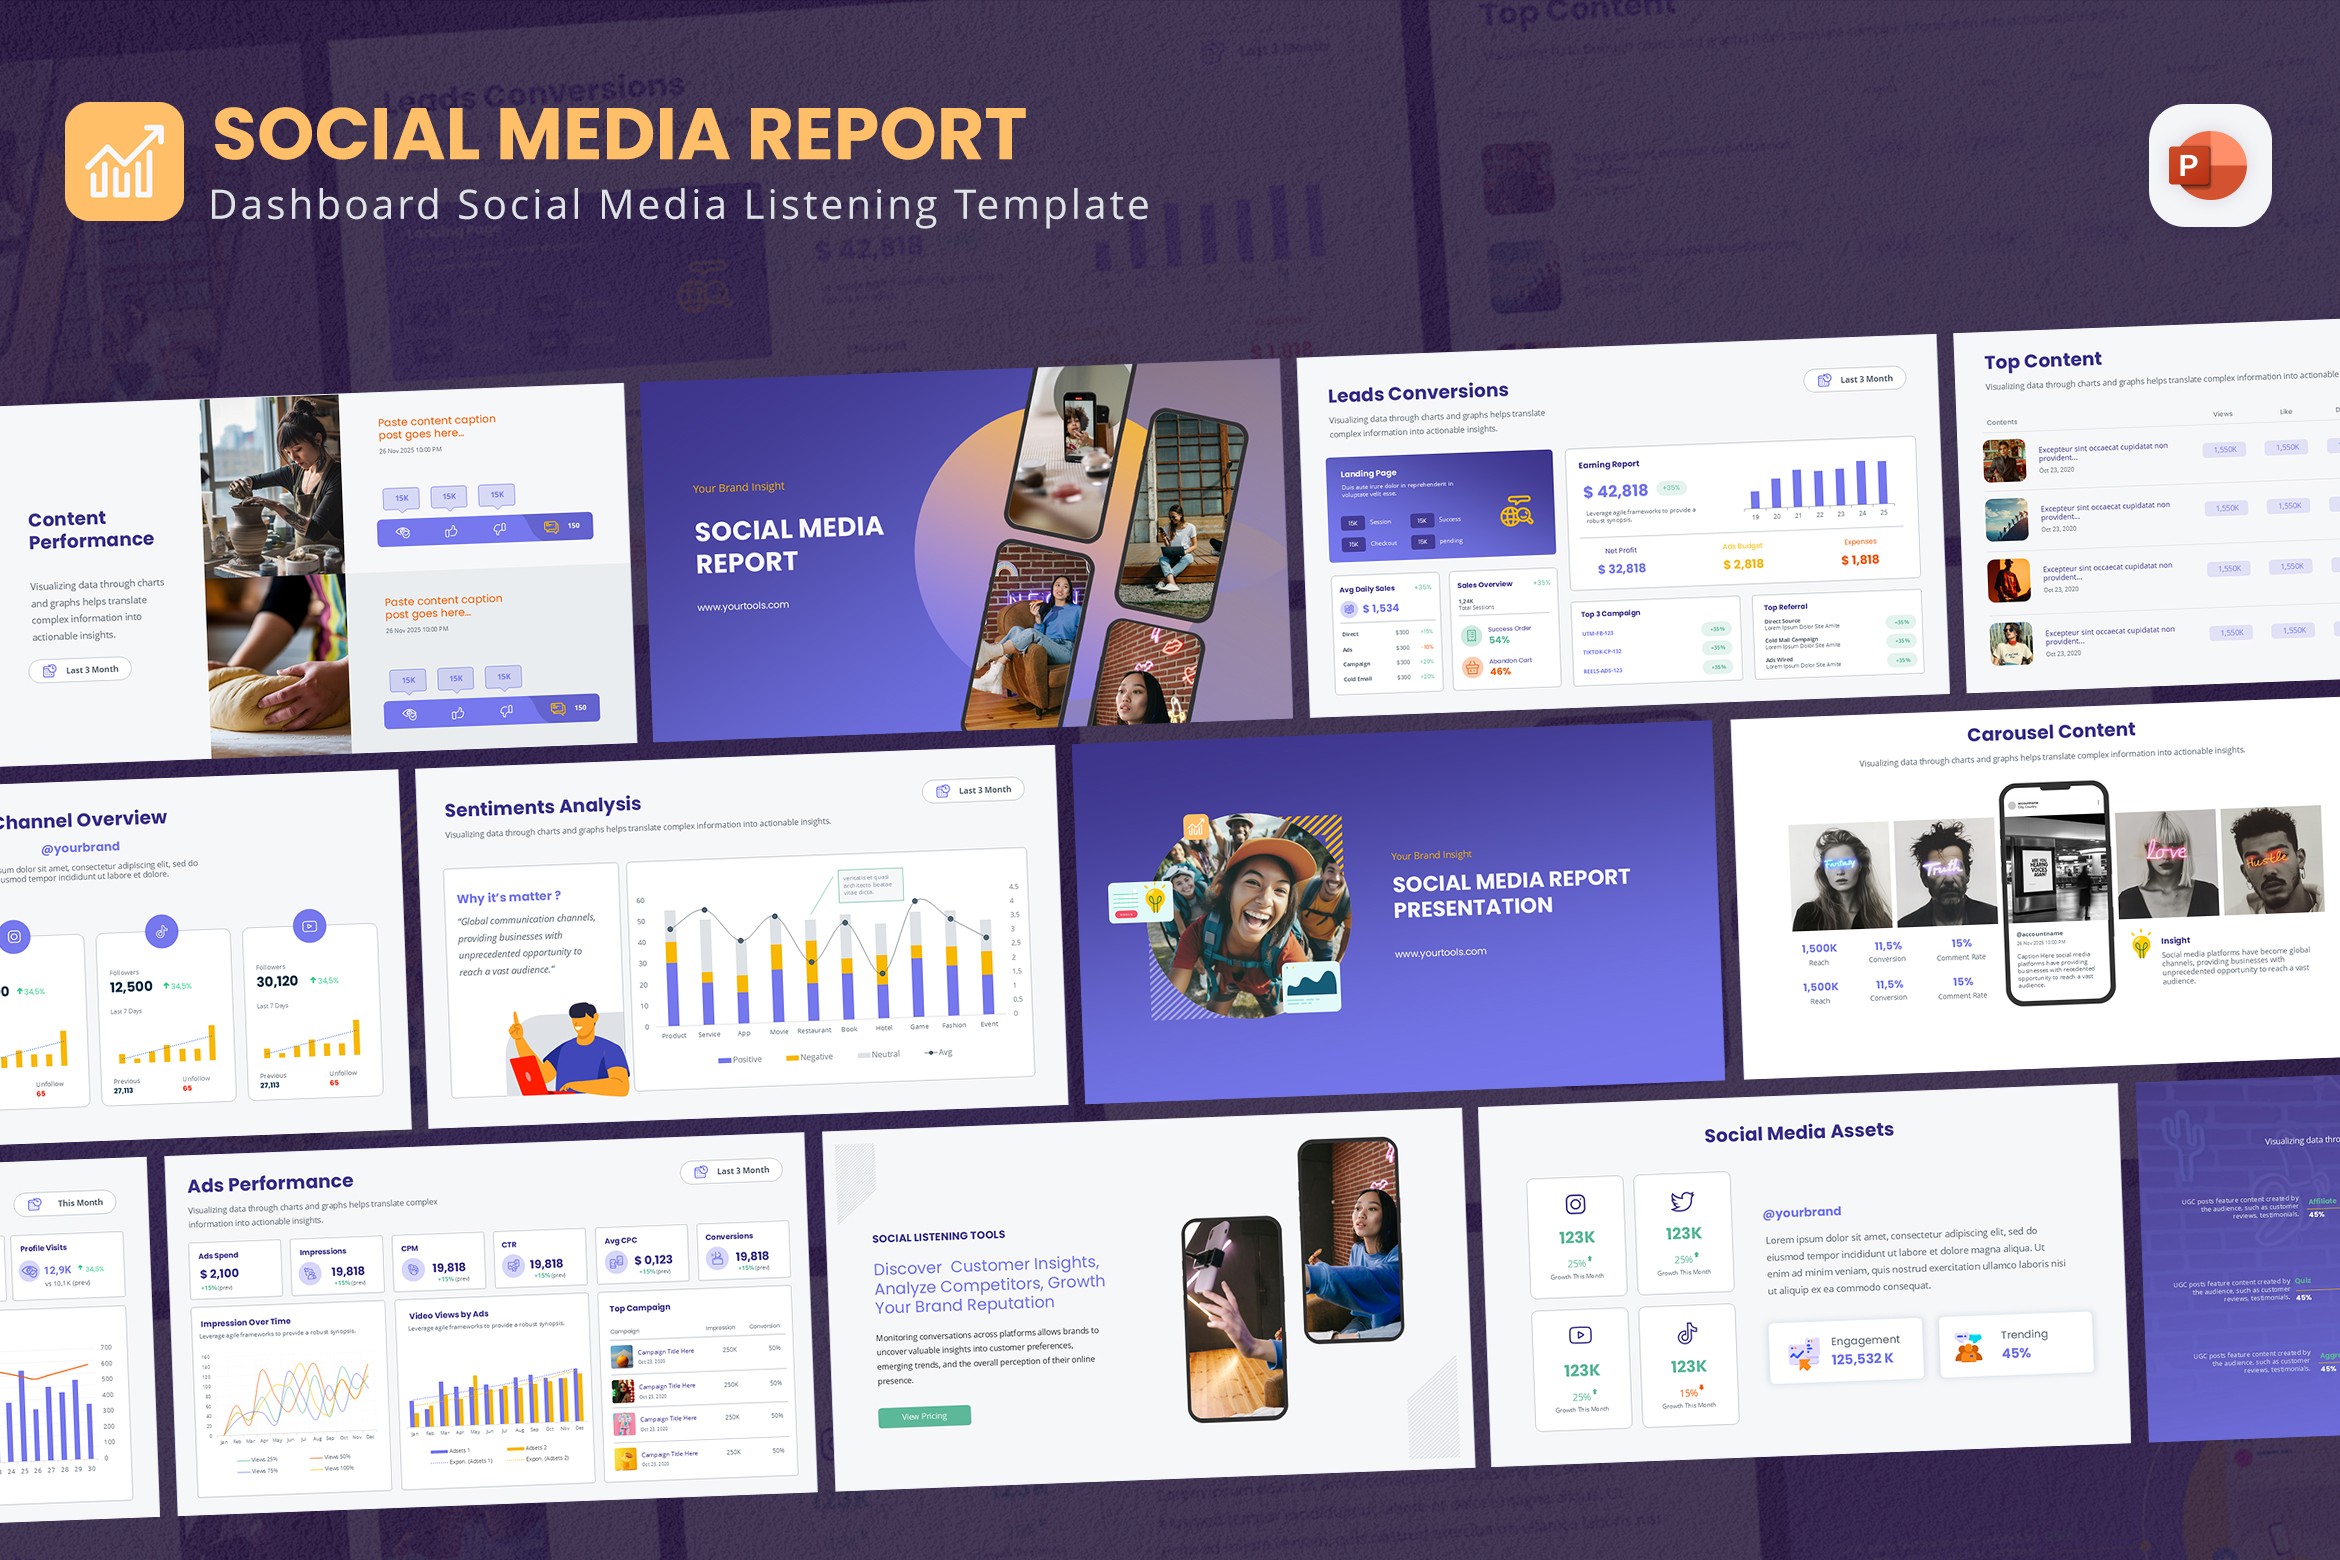
New Social Media Dashboard PowerPoint Template
What’s inside:
- 25 modern, editable slides
- Pre-built layouts for different platforms (Instagram, YouTube, TikTok, etc.)
- Easy-to-use charts and analytics sections
- Professional, clean design — ready to customize
Perfect for freelancers, marketers, or agencies who need to deliver polished reports fast.
Quick Tips Before You Share
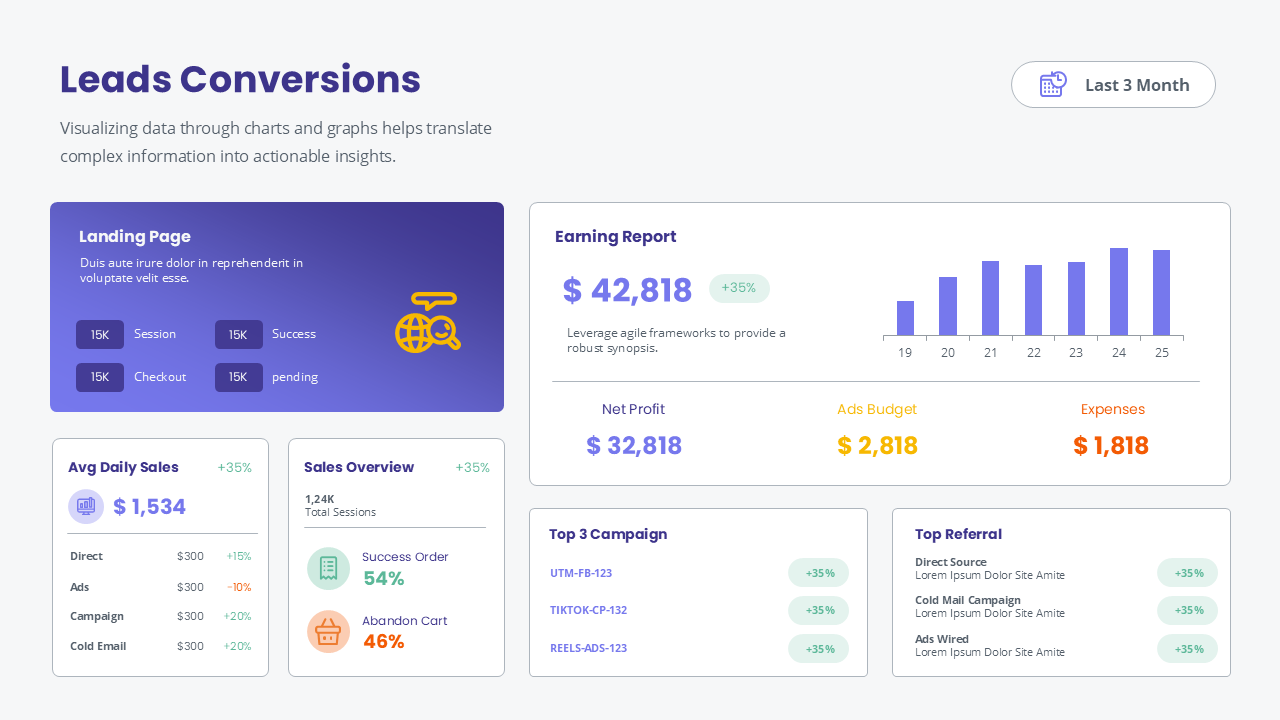
- Keep it visual — use charts, not just numbers
- Focus on what matters most to your audience
- Stay consistent with fonts, colors, and layout
- Use simple language and short explanations
Tell the Story Behind the Numbers
Data is powerful — but only if people understand it. A well-made social media report helps you communicate clearly, build trust, and make better decisions going forward.
Ready to try it?
Get the New Social Media Dashboard PowerPoint Template here