
Let’s be real—nobody likes a slide full of numbers dumped like it’s an Excel sheet with stage fright. Whether you’re presenting a marketing report, sales performance, or startup pitch, your data deserves better. And by “better,” I mean a clean, well-designed dashboard PowerPoint template that actually makes people look—and understand—what you're trying to say.
In this post, I’ll walk you through why dashboards matter, how to make your data presentation less boring, more bold, and why using a dashboard template might just save your (Power)point.
What is a Dashboard PowerPoint Template Anyway?
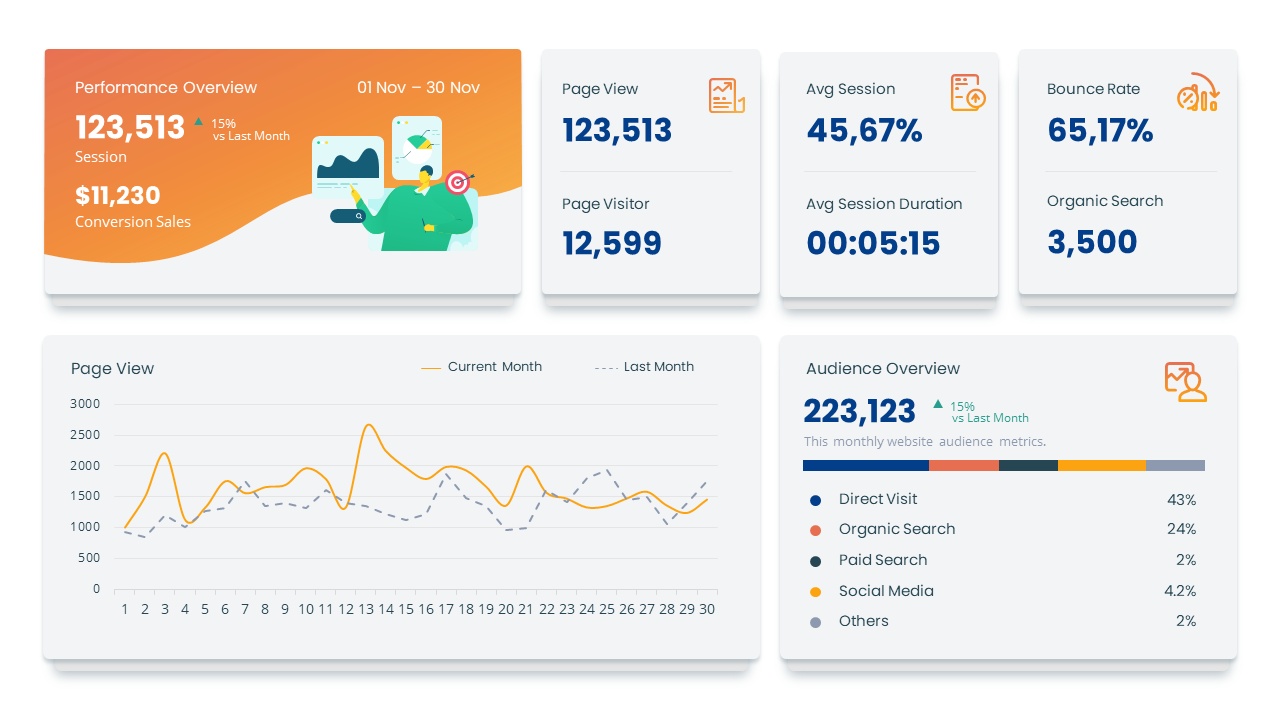
Think of it like a visual command center for your data. A dashboard template is a set of slides specifically designed to showcase key metrics, KPIs, and performance insights in a digestible, visual format. Instead of going slide-by-slide explaining numbers, you present the story all at once—with clean graphs, icons, color-coded indicators, and layouts that help your audience connect the dots fast.
Why Use a Dashboard Template?
Here’s the deal—most presentations fail not because the data’s bad, but because the data is buried under poor design.
A good dashboard template:
- Makes complex data easy to understand
- Helps you tell a story with your numbers
- Saves time with pre-designed layouts
- Keeps your slides on-brand and on-point
Whether you're pitching to investors, updating the team, or sending a client report, using a dashboard template instantly makes you look more polished and professional. It’s like showing up to a meeting in a tailored suit instead of pajama pants.
Design Tips: Make Your Dashboard Work for You
Even with a solid template, how you use it still matters. Here are a few quick tips to get the most out of your dashboard slides:
- Start with the “Why”
What’s the story you want to tell? Are sales going up? Is customer retention dipping? Your dashboard should highlight key messages at a glance. - Keep It Clean
Less is more. Use whitespace. Don't clutter every inch of the slide with charts. Let your numbers breathe. - Use Visual Hierarchy
Not all metrics are created equal. Make your most important KPIs pop using bold fonts, colors, or bigger sizing. - Stick to One Theme
Consistency is key. If your template uses a certain color palette and font combo, don’t stray. It keeps the whole deck looking intentional. - Label Everything
Don’t assume everyone knows what “CR%” or “NPS” means. Clear labels = clear understanding.
Ready-to-Use: Dashboard Templates That Save Time (and Sanity)
Let’s face it—designing your own slides from scratch? That’s a full-time job (and probably not one you’re getting paid extra for). That’s where dashboard PowerPoint templates come in handy.
There are tons of pro-level templates out there with:
- Multiple dashboard layouts (marketing, finance, project tracking, etc.)
- Editable infographics and KPI blocks
- Data-driven charts you can plug straight into Excel
- Consistent, clean, and modern design
If you want one that’s ready to go, check out our Dashboard Templates Collection – built for real-world use, with just the right balance between looks and function.
Also Read : Best Business Plan & Marketing Plan Powerpoint Template
Final Thoughts: Show, Don’t Just Tell
In 2025, no one has time to squint at slides and figure out what you meant. With a solid dashboard template, you can turn raw data into real impact—and look like a total pro while doing it.
So next time you’re building a deck, skip the spreadsheet screenshots. Use a dashboard. Tell a better story.
Your data deserves it.